Price Reversal Probability + Price Forecast
Beyond Guesswork: Predict Market Reversals With Statistical Precision
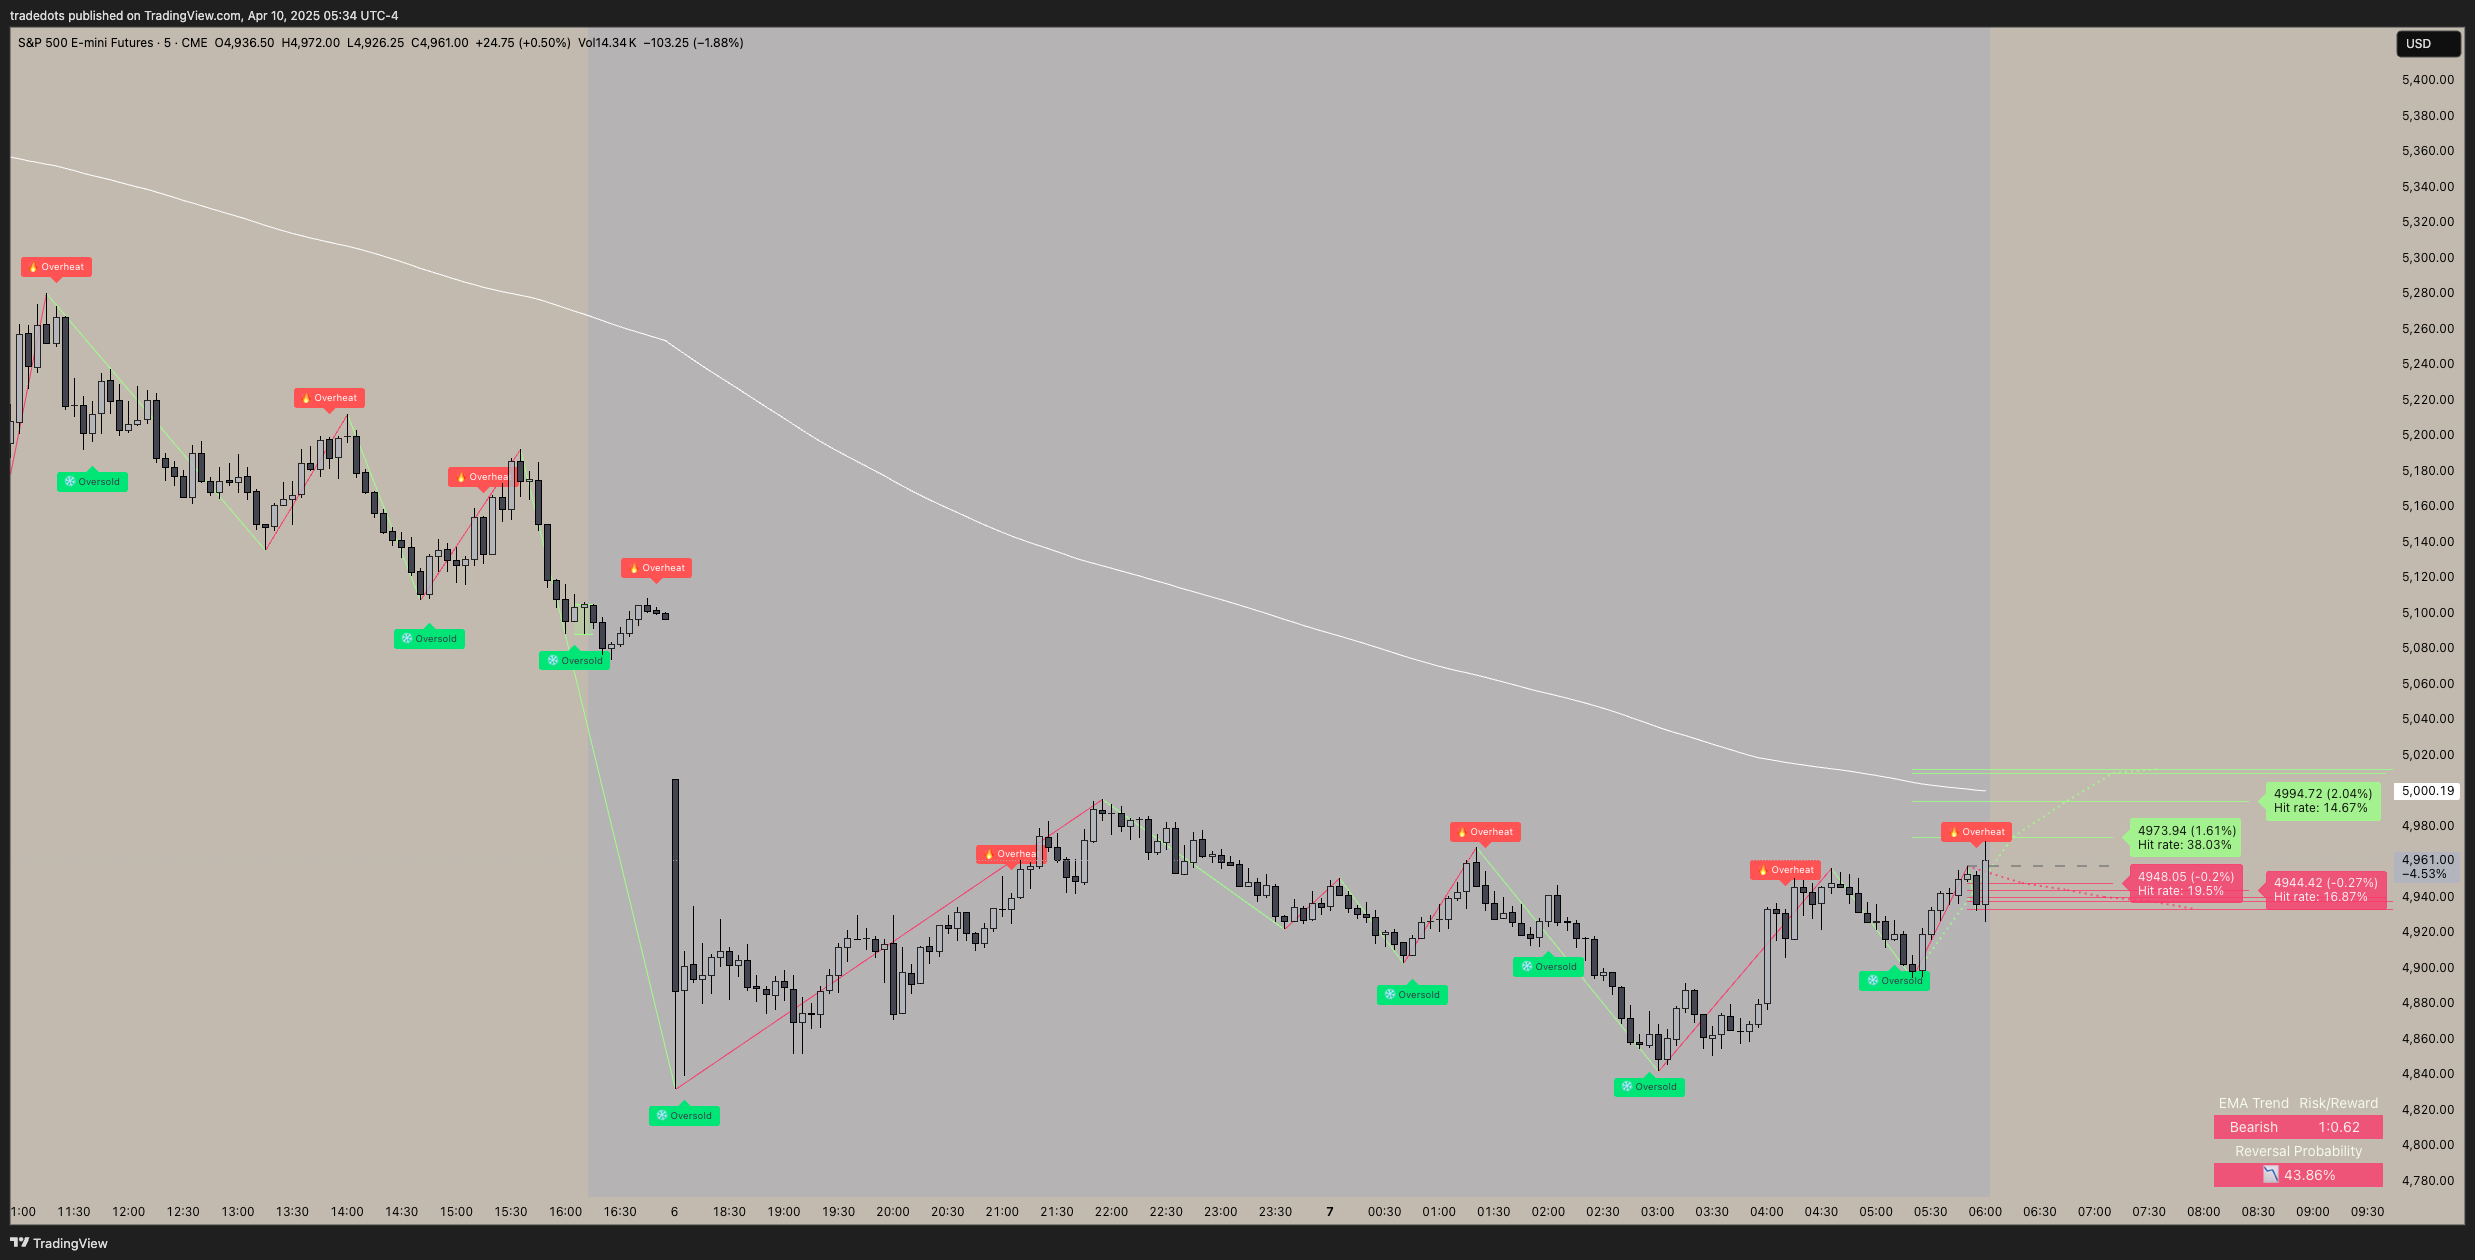
The Price Reversal Probability + Price Forecast indicator revolutionizes how traders identify potential market turning points. Unlike conventional indicators that provide simple buy/sell signals without context, this advanced tool quantifies the statistical likelihood of price movements and projects future price targets with specific probability percentages.
This powerful combination of reversal detection and statistical forecasting transforms subjective technical analysis into a quantitative framework, allowing you to make data-driven trading decisions with confidence and precision.
Why Traditional Reversal Indicators Fall Short
Most traders struggle with market reversals because traditional indicators:
- Lack statistical context for how likely a reversal actually is
- Provide no specific price targets for potential moves
- Fail to quantify probability of different outcomes
- Can't identify truly extreme price conditions objectively
The Price Reversal Probability + Price Forecast indicator solves these challenges with a sophisticated Bayesian probability model that quantifies reversal likelihood, projects multiple price targets with specific probabilities, and identifies statistically extreme price conditions—all in real-time and with exceptional clarity.
Key Components That Power Your Statistical Edge
1. Advanced Probability Analysis System
At the core of this indicator is a sophisticated Bayesian probability model that:
- Tracks historical pivot points (highs and lows) with precision
- Records success/failure rates of similar patterns
- Calculates cumulative probabilities for reversals
- Adjusts projections based on market volatility
- Identifies statistically extreme conditions where reversals are most likely
This statistical approach transforms subjective pattern recognition into objective probability assessment.
2. Dynamic Price Forecasting Engine
For each potential reversal point, the indicator:
- Projects multiple price targets based on historical behavior
- Assigns specific probability percentages to each target
- Automatically adjusts for current market volatility
- Provides visual representation directly on your chart
- Updates projections in real-time as new data emerges
3. Market Structure Detection
The indicator identifies key market conditions that often precede reversals:
- Bearish reversal patterns with probability assessment
- Bullish reversal patterns with probability assessment
- Extreme overbought conditions with statistical validation
- Extreme oversold conditions with statistical validation
4. Comprehensive Visual System
The indicator transforms complex statistical analysis into clear visual insights:
- Probability Labels - Display price targets with specific probability percentages
- Reversal Pattern Markers - Identify potential reversal points
- Support & Resistance Lines - Show key price levels
- Probability Table - Detailed statistical breakdown
- Trend Panel - Quick overview of current market state
Trading Strategies For All Experience Levels
For New Traders: The Probability Basics Strategy
Perfect if you're just beginning to use statistical analysis in trading:
-
Identify Potential Reversal Points:
- Red Dots (🔴) - Potential bearish reversal points (selling opportunities)
- Green Dots (🟢) - Potential bullish reversal points (buying opportunities)
- Focus on dots that appear at price extremes for highest probability
-
Understand the Probability Labels:
- Each price forecast line shows the projected price level
- The percentage indicates the statistical likelihood of reaching that level
- Higher percentages (>70%) indicate stronger probability
- Direction arrows show expected price movement
-
Implement Basic Probability Trading:
- Enter trades at identified reversal points
- Target the highest probability price levels for exits
- Place stops beyond the extreme level in the opposite direction
- Size positions based on probability confidence
-
Recommended Settings:
- Enable "AutoPilot" for automatic volatility detection
- Show price targets to visualize potential moves
- Use percentage labels to understand probability magnitude
- Start with default settings for balanced performance
For Intermediate Traders: The Statistical Edge Strategy
Elevate your trading with this more sophisticated approach:
-
Focus on Extreme Statistical Conditions:
- Look for the 1% probability markers that indicate statistically rare price levels
- These extreme conditions often precede significant reversals
- Enter with higher conviction when price reaches these statistical extremes
- Use tighter stops due to higher reversal probability
-
Implement Probability-Based Position Sizing:
- Size positions according to probability confidence
- Larger positions for higher probability setups (>80%)
- Smaller positions for moderate probability setups (50-70%)
- Scale into positions at different probability levels
-
Use Multi-Target Exit Strategy:
- Take partial profits at first probability target (often highest probability)
- Move stops to breakeven after first target is reached
- Allow remainder of position to reach secondary targets
- Exit remaining position at lowest probability target or when new signal emerges
For Advanced Traders: The Complete Statistical System
Maximize your edge with this comprehensive approach:
-
Fine-Tune Your Probability Analysis:
- Adjust bullish/bearish sensitivity to customize projections
- Increase/decrease the number of price target lines based on market volatility
- Use MA trend background to confirm overall market direction
- Combine with support/resistance analysis for enhanced precision
-
Implement Advanced Pattern Recognition:
- Identify sequences of reversal patterns to determine trend strength
- Watch for failed patterns that may indicate stronger continuation
- Monitor probability changes over time for trend confirmation
- Use probability clusters to identify key price zones
-
Develop a Statistical Portfolio Approach:
- Allocate capital based on probability confidence across multiple instruments
- Balance high-probability reversals with trend continuation trades
- Use correlation analysis to avoid overexposure to similar setups
- Implement portfolio-level risk management based on cumulative probabilities
Understanding The Probability Calculations
The indicator uses a proprietary statistical model that goes beyond simple historical percentages:
1. Bayesian Probability Framework
This advanced statistical approach:
- Combines independent probabilities into cumulative likelihood
- Updates probabilities as new information emerges
- Accounts for multiple pattern confirmations
- Weighs recent market behavior more heavily than distant history
2. Historical Pattern Analysis
The system meticulously tracks:
- Pivot highs and lows across multiple timeframes
- Price movements following similar patterns
- Success and failure rates of reversal attempts
- Magnitude of moves following successful reversals
3. Volatility Normalization
To ensure accuracy across different market conditions, the indicator:
- Uses standard deviation to normalize projections
- Automatically calibrates in "AutoPilot" mode
- Adjusts probability thresholds based on current volatility
- Identifies outlier conditions that fall outside normal distribution
4. Extreme Condition Identification
The most powerful feature for reversal traders:
- Marks price levels with 1% probability
- Highlights rare market conditions with high reversal potential
- Provides earliest warnings of potential trend changes
- Identifies statistical outliers where smart money often acts
Real-World Trading Examples
Example: Capturing a Major Bitcoin Reversal
In this Bitcoin daily chart example:
- The Setup: Bitcoin had been in a strong uptrend but reached extreme statistical levels
- The Signal: A red dot (🔴) appeared with a 1% probability marker, indicating a statistically extreme condition
- The Forecast: Multiple price targets were projected with probabilities:
- First target: $58,200 (85% probability)
- Second target: $54,800 (65% probability)
- Third target: $51,200 (40% probability)
- The Result: Bitcoin reversed and reached all three targets in the following weeks, with the highest probability target hit first
Example: Identifying a Bullish Reversal in Tesla
In this Tesla 4-hour chart example:
- The Setup: Tesla had declined to a statistically significant support level
- The Signal: A green dot (🟢) appeared with a 78% probability of reversal
- The Forecast: Multiple price targets were projected with probabilities:
- First target: $242.50 (80% probability)
- Second target: $256.75 (60% probability)
- Third target: $268.30 (35% probability)
- The Result: Tesla reversed and rallied to the first two targets, providing excellent risk-reward opportunities
Customization: Tailoring The Indicator To Your Trading Style
Price Prediction Settings
- AutoPilot: Automatically detects market volatility and adjusts price targets
- Recommended for most users to ensure appropriate scaling
- Can be disabled for manual adjustment in specific market conditions
- Show Price Targets: Toggles visibility of price forecast lines
- Number of Lines: Controls how many price targets are displayed (1-20)
- Lower settings (3-5): Cleaner chart, focus on highest probability targets
- Higher settings (10+): More comprehensive view of potential scenarios
- Bull/Bear Sensitivity: Manually adjusts price targets higher or lower
- Increase bullish sensitivity in strong uptrends
- Increase bearish sensitivity in strong downtrends
Visual Settings
- All Reversal Patterns: Shows all detected reversal points
- Bearish/Bullish Reversal Patterns: Filters specific reversal types
- Price/Percentage Labels: Customizes information on price target labels
- Extreme Buy/Sell Labels: Toggles visibility of 1% probability levels
- MA Trend Background: Colors chart background based on MA relationship
- Support & Resistance: Shows automatically detected S/R levels
Trendline Settings
- Trendline Type: Choose between SMA, EMA, SMMA, WMA, VWMA
- Trendline Source: Select price data for trendline calculation
- Trendline Length: Set the period for the trendline calculation
Table Settings
- Probability Table Location: Position of the detailed statistics table
- Trend Panel Location: Position of the trend overview panel
- Table Size & Color: Customization options for visual elements
Statistical Trading Strategies
Extreme Level Reversal Strategy
This high-probability approach focuses on statistically rare price conditions:
- Setup: Wait for price to reach an extreme level (1% probability)
- Entry: Enter when a reversal signal appears at the extreme level
- Stop Loss: Place a tight stop beyond the extreme level
- Take Profit: Target the first probability level (usually highest probability)
- Risk Management: Larger position size due to favorable statistical edge
Probability-Based Scaling Strategy
This sophisticated approach uses probability levels for position management:
- Entry: Full position at initial reversal pattern
- First Target (Highest Probability): Take 50% of position off
- Second Target (Medium Probability): Take 25% of position off
- Final Target (Lowest Probability): Exit remaining 25%
- Stop Management: Move stop to breakeven after first target is hit
Mean Reversion Strategy
This statistical approach capitalizes on price returning to average conditions:
- Setup: When price reaches extreme levels away from the MA
- Entry: Enter when reversal signal appears and price begins moving back toward MA
- Stop Loss: Beyond extreme price level
- Take Profit: When price returns to the moving average
- Filter: Only take trades in the direction of the larger trend
Multi-Timeframe Probability Strategy
This advanced approach aligns probabilities across timeframes:
- Setup: Identify reversal signals on higher timeframe (daily)
- Confirmation: Look for aligned reversal signals on lower timeframe (4H/1H)
- Entry: Enter when probabilities align across timeframes
- Stop Loss: Beyond the extreme level on lower timeframe
- Take Profit: Use higher timeframe probability targets
- Risk Management: Increase position size when probabilities align across multiple timeframes
Pro Trading Tips: Maximizing Your Statistical Edge
1. Probability Confluence Creates Opportunity
The most powerful setups occur when multiple factors align:
- Price reaches a 1% probability extreme
- Multiple timeframes show aligned probability signals
- Key support/resistance levels coincide with probability targets
- Market structure confirms potential reversal points
2. Understand Probability vs. Certainty
Even high-probability setups can fail:
- 80% probability means 1 in 5 similar setups will not reach the target
- Always use appropriate risk management regardless of probability
- Consider reducing position size when trading against strong trends
- Use stops to protect capital when probabilities don't play out
3. Combine With Market Context
Enhance probability analysis with broader market understanding:
- Higher probabilities in the direction of the larger trend
- Lower probabilities when fighting strong momentum
- Use market structure analysis to validate probability signals
- Consider fundamental factors that might override statistical patterns
4. Optimize For Your Timeframe
Different trading styles require different probability approaches:
- Day Traders: Focus on extreme short-term probabilities with quick targets
- Swing Traders: Use 4H/Daily probability targets with partial scaling
- Position Traders: Focus on weekly probability extremes for larger moves
Frequently Asked Questions
Q: How accurate are the probability percentages?
A: The probability percentages are derived from historical pattern analysis and Bayesian statistics. While no prediction can be 100% accurate, extensive backtesting shows that the probability percentages closely match actual outcomes when measured across a large sample of trades. Higher probability targets (>70%) are reached approximately 7 out of 10 times in similar market conditions.
Q: How often do extreme (1%) conditions occur?
A: Statistically extreme conditions (1% probability) typically occur:
- 2-5 times per month on daily charts
- 5-10 times per month on 4-hour charts
- More frequently on lower timeframes
These rare conditions often provide the highest probability reversal opportunities.
Q: Which markets work best with this indicator?
A: The Price Reversal Probability indicator works effectively across all major markets:
- Forex: Excellent for identifying statistical extremes in major pairs
- Cryptocurrencies: Particularly effective due to their tendency to reach statistical extremes
- Stocks: Works well, especially on liquid, high-volume stocks
- Indices: Very effective for capturing major turning points
Q: Should I use AutoPilot or manual sensitivity settings?
A: For most traders, AutoPilot mode is recommended as it automatically adjusts to market volatility. Manual sensitivity adjustments are best used by experienced traders who:
- Trade specific instruments with unique characteristics
- Want to fine-tune the indicator for particular market conditions
- Have developed a specialized trading approach requiring customization
- Are combining the indicator with other proprietary systems
Q: How does this compare to other reversal indicators?
A: Unlike traditional reversal indicators that simply identify potential turning points, the Price Reversal Probability indicator:
- Quantifies the statistical likelihood of reversals
- Provides specific price targets with probability percentages
- Identifies truly extreme conditions based on statistical analysis
- Adapts automatically to changing market volatility
- Offers a complete probabilistic framework rather than simple signals
Transform Your Trading With Statistical Precision
The Price Reversal Probability + Price Forecast indicator revolutionizes how you identify and trade market reversals by transforming subjective technical analysis into a quantitative framework. By providing specific probability percentages for potential price movements, it helps you:
- Make data-driven decisions based on statistical edge rather than emotion
- Identify optimal entry points at statistically significant extremes
- Set realistic profit targets based on probability percentages
- Manage risk precisely with statistical context
- Recognize truly extreme conditions where reversals are most likely
Whether you're a new trader seeking clarity in your reversal trading or an experienced professional looking to add statistical precision to your analysis, this powerful indicator provides the quantitative edge needed to trade with confidence in an uncertain market.